
Guardian Performance Analyzer (GPA) User Guide


Guardian Performance Analyzer (GPA) User Guide – (544541-006) Page 109 of 131
Optional Report Section for the SYSTEM Class
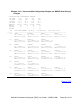
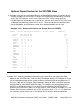
In Example 4-30, you can see that the primary and backup disk processes account for the
majority of processes for \NODEC. You can also evaluate the distribution by scanning
across the CPU columns. In this case, CPU 0 and CPU 2 have nearly twice the
number of primary disk processes as the others. You can also see that CPU 2 has only
12 backup disk processes while CPU 1 has 31. These disk processes could be more
evenly distributed, and GPA bases some of its recommendations on this fact.
Example 4-30. Summary Section for the System Class for \NODEC
SYSTEM Process Distribution Analysis - Process Counts IMAGE 20
Process Cpu Cpu Cpu Cpu Tot
Name #00 #01 #02 #03 Cnt
-------- --- --- --- --- ----
DISK-B 15 31 12 27 85
DISK-P 22 6 36 21 85
DISK-T 12 12 24
IPB 1 1 2
MONITOR 1 1 1 1 4
MSENGER 1 1 1 1 4
NCP 1 1 2
OSP 1 1 2
TMP 1 1 2
UnNamed 2 2 1 1 6
VIRTUAL 1 1 1 1 4
Z0 1 1 2
ZNUP 1 1 2
$FOXLH? 3 3 6
$TAP?? 2 2 4
$TRM1? 4 4 8
$ZA000 1 1 2
-------- --- --- --- --- ----
TOTALS 70 70 52 52 244
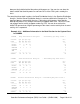
Example 4-31 shows the additional information you receive when you specify the detail
option for the SYSTEM class. From the Busy Distribution Analysis in Example 4-31, you
can find what percentage of the system resources are being used on the processes in
the class. Note that in the figure, the percentages add up to 100% so that the data can
be described as “normalized” within the class. For example, the primary disk process
(DISK-P) in CPU 0 consumed 17% of the CPU cycles used by the SYSTEM Class.
Since the SYSTEM Class spent 18% of the cycles in CPU 0 (refer to Example 4-11), the
Primary Disk Process used about 3% of CPU 0‟s cycles (18% * 17% = 3.1%). Based on
the summary section for the class, CPU 0 and CPU 2 have the heaviest workloads