
Guardian Performance Analyzer (GPA) User Guide


Guardian Performance Analyzer (GPA) User Guide – (544541-006) Page 111 of 131
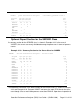
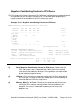
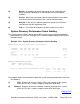
SYSTEM Queue Distribution Analysis - Descending QueueLen Class %
Process Cpu Cpu Cpu Cpu Cls
Name #00 #01 #02 #03 Pct
-------- --- --- --- --- ----
DISK-P 29 2 21 3 56
MONITOR 9 6 6 6 29
VIRTUAL 4 4
TMP 4 4
Z0 1 1
MSENGER 1 1
UnNamed 1 1
-------- --- --- --- --- ----
TOTALS 45 11 32 10 99
Optional Report Section for the SERVER Class
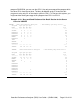
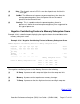
A summary section for the SERVER class is shown in Example 4-32. In the case of
\NODEC, the servers are evenly distributed among the processors in terms of process
counts.
Example 4-32. Summary Section for the Server Class for \NODEC
SERVER Process Distribution Analysis - Process Counts
Program Cpu Cpu Cpu Cpu Tot
Name #00 #01 #02 #03 Cnt
-------- --- --- --- --- ----
EMULD 48 48 48 48 192
FAPALL 1 1
HOPR 1 1 2
LU62 2 2 2 2 8
NETBATCH 1 1
RCAPS510 3 2 1 2 8
RCAPS515 2 3 1 2 8
RCAPS550 2 3 1 2 8
RCAPS600 2 2 2 2 8
RCAPS610 1 3 2 2 8
RCAPS640 3 1 1 3 8
RCAPS900 2 2 2 2 8
VISAOT 4 4 4 4 16
-------- --- --- --- --- ----
TOTALS 71 71 65 69 276
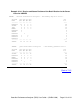
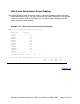
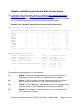
The additional information in the detail section for the SERVER class is shown in Example
4-33 and Example 4-34. Program VISAOT consumes the most CPU time for the class
even though it has a much lower process count than EMULD. Upon close inspection of