
Guardian Performance Analyzer (GPA) User Guide

Guardian Performance Analyzer (GPA) User Guide – (544541-006) Page 48 of 131
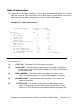
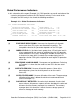
Disk Volume Performance
This subsection of the report (Example 3-2) is a table that indicates the extremes in disk
volume performance for the node. The format is such that the differences in high and
low values can easily be seen as an indication of system performance.
Example 3-2. Disk Volume Performance
I I. DISK VOLUME PERFORMANCE
VOLUME BUSY% REQUEST CPU CACHE REQUEST % OF ALL
QTIME (s) HIT% RATE/SEC CACHE CALL
1
LOW BUSY DISK VOL : $X42 .0 0 2: 3 0.0% 0 0%
2
HI BUSY DISK VOL : $SYSTEM 18.9 25 0: 1 66.1% 12 57%
3
LOW Q-TIME VOL : $ClO 4.2 19 0: 1 90.2% 3 16%
4
HI Q-TIME VOL : $PROJEC .0 114 2: 3 99.7% 1 4%
5
*LOW BUSY DISK PROC: $B40 .1 0 0: 1 0.0% 0 0%
6
*HI BUSY DISK PROC: $SYSTEM 7.2 25 0: 1 66.1% 12 57%
7
*LOW CACHE PERF. : $XPRESS 1.7 51 2: 3 52.6% 0 4%
8
*HI CACHE PERF. : $NSMS 6.3 24 2: 3 99.9% 4 20%
(* relates to the disk process. request-qtime is expressed in Ms).
The table identifies, as line items, (1) the least busy and (2) most busy volumes, the
volumes with (3) the lowest and (4) highest request q(ueue) times, the volumes
associated with (5) the least busy and (6) most busy disk processes, and the volumes
with (7) the lowest and (8) highest percentages of cache hits.
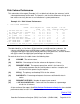
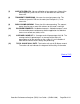
For each of these items, the table shows the following data:
(9)
VOLUME: The volume name.
(10)
BUSY%: Percentage of time the volume or disk process is busy.
(11)
REQUEST QTIME: The request queue time, which is the interval (in
milliseconds) between the time a disk process receives a request and
the time it finishes processing the request.
(12)
CPU(s): The primary and backup CPUs for the volume.
(13)
CACHE HIT%: Percentage of requests that were satisfied with data in
cache.
(14)
REQUEST RATE/SEC: Number of requests per second.
(15)
% OF ALL CACHE CALL: Cache calls for the volume as a percentage
of calls for all volumes.
A later section of the report, titled Disk Volume Performance Analysis, gives detailed
performance data for each volume in the node.
[Back to TOC]