
Guardian Performance Analyzer (GPA) User Guide

Guardian Performance Analyzer (GPA) User Guide – (544541-006) Page 50 of 131
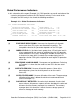
(7)
OVER UTILIZED CPU: No over utilization of any processors. None of the
percentage busy times for the CPUs on the node was found to be
excessive.
(8)
TRANSIENT PROCESSING: No excessive transient processing. The
number of dynamic PCBs on the node (see Example 3-1) is not
excessive.
(9)
DISK VOLUME QUEUING: Excessive disk volume queuing. The request
queue time for one or more disk volumes on the node is too high.
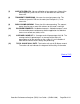
(10)
BLOCKED REQUESTS: No blocked requests. A blocked request is one
that cannot be processed because another application has blocked
access to a record, row, table, or file.
(11)
AVERAGE CACHE HIT %: Average cache hit percentage of 83.20. The
average cache hit percentage is an average of the cache hit
percentages of all the volumes on the system. It is an indication of
how well the current cache settings are performing.
(12)
TOTAL CACHE CALL RATE: Total cache call rate of 25.00 per second.
The cache call rate indicates the degree of disk activity on the node.
[Back to TOC]