
Guardian Performance Analyzer (GPA) User Guide


Guardian Performance Analyzer (GPA) User Guide – (544541-006) Page 58 of 131
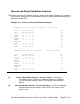
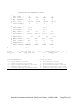
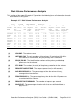
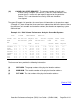
Disk Volume Performance Analysis
This section of the report (Example 3-7) provides the following items of information for each
disk volume in the system:
Example 3-7. Disk Volume Performance Analysis
DISK VOLUME PERFORMANCE ANALYSIS
1
2
3
4
5
6
7
8
9
10
VOLUME UNT CPU(S) CTL REQUEST AVG PROCESS REQUEST CACHE CACHE
NAME NOS NUM QUEUE DEVICE BUSY% RATE HIT CALLS PER
P:M PC:BC TIME BUSY% /SECOND RATE% REQUEST
-------- --- ----- --- ------- ----- ------- ------- ----- ---------
$SYSTEM 0:1 0: 1 %01 25.11 18.91 7.25 12.12 66.1 1.0
$NSMS 0:1 2: 3 %01 24.26 0.00 6.36 4.03 99.9 1.2
$ClO 2:3 0: 1 %01 19.19 4.22 2.62 3.22 90.2 1.2
$PROJEC 2: 2: 3 %01 114.23 0.00 5.63 1.06 99.7 1.2
$DRIVER 4: 0: 1 %01 26.49 1.93 0.88 1.09 90.7 0.9
$XPRESS 3: 2: 3 %01 51.38 0.00 1.72 0.00 52.6 1.3
$MEAS 4:5 2: 3 %01 56.45 0.00 0.54 0.00 0.0 2.6
$B40 5: 0: 1 %01 0.00 0.41 0.19 0.00 0.0 4.0*
$X42 6: 2: 3 %01 0.00 0.00 0.50 0.00 0.0 6.0*
(1)
VOLUME: The volume name.
(2)
UNT NOS P:M: The unit numbers of the primary (P) and mirror (M) disks.
If the device is not mirrored, only the primary disk is identified.
(3)
CPU(S) PC:BC: The identification numbers of the primary and backup
processors for the volume.
(4)
CTL NUM: The number (in octal) of the primary controller for the volume.
(5)
REQUEST QUEUE TIME: The request queue time (in milliseconds).
(6)
AVG DEVICE BUSY%: The percentage of time the volume is busy,
averaged for mirror devices.
(7)
PROCESS BUSY%: The percentage busy time for the disk I/O processes
associated with the volume.
(8)
REQUEST RATE/SECOND: The number of requests per second.
(9)
CACHE HIT: The percentage of cache calls that are satisfied without a
physical I/O.