
Guardian Performance Analyzer (GPA) User Guide


Guardian Performance Analyzer (GPA) User Guide – (544541-006) Page 60 of 131
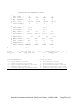
Cache Performance Analysis
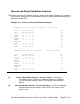
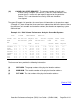
This section of the report (Example 3-9) is a table that shows cache block data for each of
the disk volumes in the system. For each volume, the table gives information for each
size of cache block (512 bytes, 1024 bytes, 2048 bytes, and 4096 bytes):
Example 3-9. Cache Performance Analysis
CACHE PERFORMANCE ANALYSIS
1 2 3
LOGICAL | ALLOCATED CACHE | CACHE HIT RATES | REQUEST RATES
VOLUME | 512 1024 2048 4096 | 512 1024 2048 4096 | CACHE BLOCK/SECOND
| BLKS BLKS BLKS BLKS | | 512 1024 2048 4096
| | |
$SYSTEM | 24 22 21 64 | 25 84 20 66 | .4 13.2
$NSMS | 24 22 21 64 | 99 | 5.5
$ClO | 24 22 21 64 | 55 58 90 | 4.8
$PROJEC | 24 22 21 64 | 99 | 1.6
$DRIVER | 24 22 21 64 | 42 85 90 | .1 .9
$XPRESS | 24 22 21 64 | 6 99 | .6 .5
$MEAS | 24 22 21 64 | 78 |
$B40 | 24 22 21 64 | 80 |
$X42 | 24 22 21 64 | 85 |
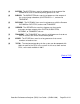
(1)
ALLOCATED CACHE: Number of blocks allocated.
(2)
CACHE HIT RATES: Percentage of cache hits.
(3)
REQUEST RATES CACHE BLOCK/SECOND: Number of requests per
second.
[Back to TOC]