
Guardian Performance Analyzer (GPA) User Guide

Guardian Performance Analyzer (GPA) User Guide – (544541-006) Page 68 of 131
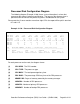
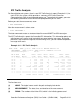
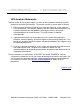
Expected System Performance After Tuning
This section of the report (Example 3-14) contains Processor Load Balance and
Performance Charts, the same two types of charts as those described earlier. Here,
the data show what the system conditions would be if all of the GPA tuning
recommendations were followed.
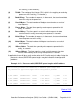
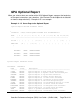
Example 3-14. Expected System Performance After Tuning
ESTIMATED PERFORMANCE PROFILE AFTER TUNING CHANGES.
CPU PROCESSOR LOAD BALANCE CHART
NUM
--- ROUNDED TO NEAREST TWO PERCENT (2%)
|----+----+----wwww^wwww-+----+----+----+----+----|
0 |+++----------> ^
1 |+++++++++---------^--------->
2 |+++----------> ^
3 |++++------------> ^
|----+----+----wwww^wwww-+----+----+----+----+----|
0 1 2 3 4 5 6 7 8 9 1
0 0 0 0 0 0 0 0 0 0
0
CPU PERCENT BUSY -------------------------------->
PROCESSOR PERFORMANCE CHART
CPU NUM : 0 1 2 3
CPU TYPE : TXP TXP TXP TXP
MB MEMORY: 8 8 8 8
PCT BUSY% : 28.66 58.87 30.34 34.89
DISK PRIME : 2 3 2 2
DISK RATE : 11.8 .1 11.5 1.7
CHIT RATE : 16.9 11.7
MSG RATE : 111 197 69 77
DISP RATE : 280.6 416.9 225.7 229.1
SWAP RATE : .01 .02 .02 .04
MMGR PAGES : 1555 1310 749 997
PCB COUNT : 88 77 80 87
TRANSIENTS : 5 3 3 8
HALT IMPACT: MEMORY NONE NONE NONE
CPU Count: 4 Avg CPU Busy (^): 38.1 Tuning Window (w): 8
PCB Count: 332 Node SWAP Rate : .09 VOLUME Count : 9
CPU FLAG EXPLANATIONS: + - Interrupt Busy
M - Severe Memory Shortage m - Mild Memory Shortage
P - Severe Transient Processing p - Mild Transient Processing
B - Severe Transients/Memory Shortage b - Mild Transients/Mem. Shortage