
Guardian Performance Analyzer (GPA) User Guide

Guardian Performance Analyzer (GPA) User Guide – (544541-006) Page 83 of 131
System Performance Score
In the System Performance Score subsection of the report (Examples 4-8 through
4-10), you can see which parts of the system are doing most poorly and, therefore,
have the greatest potential for improved performance through tuning. This section
rates the relative performance of the node‟s subsystems with scores ranging from 0 to
100 percent.
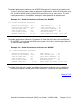
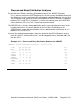
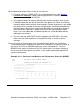
The performance scores for \NODEA (Example 4-8) clearly show how poorly some of the
subsystems are performing, mainly because of the node‟s severe memory shortage.
Example 4-8. System Performance Indicators for \NODEA
IV. SYSTEM PERFORMANCE SCORE
1. CPU SUBSYSTEM 1%
2. MEMORY SUBSYSTEM 1%
3. DISK CACHE SUBSYSTEM 83%
4. DISK VOLUME SUBSYSTEM 9%
5. SYSTEM RECOVERY PERFORMANCE 52%
*6 WEIGHTED ANALYSIS SYSTEM SCORE 1%
* Average Score rated: BEST = 100, WORST = 0.
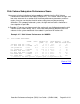
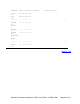
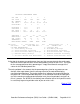
In the case of \NODEB (Example 4-9) the scores indicate that the disk volume subsystem
has the greatest potential for improvement.
Example 4-9. System Performance Indicators for \NODEB
IV. SYSTEM PERFORMANCE SCORE
1. CPU SUBSYSTEM 88%
2. MEMORY SUBSYSTEM 100%
3. DISK CACHE SUBSYSTEM 91%
4. DISK VOLUME SUBSYSTEM 26%
5. SYSTEM RECOVERY PERFORMANCE 75%
*6. WEIGHTED ANALYSIS SYSTEM SCORE 76%
* Average Score rated: BEST = 100, WORST = 0.
Example 4-10 shows that for \NODEC, on the other hand, the most potential for
improvement is in the System Recovery Performance, the Disk Volume Subsystem,
and the CPU Subsystem.