
Guardian Performance Analyzer (GPA) User Guide

Guardian Performance Analyzer (GPA) User Guide – (544541-006) Page 85 of 131
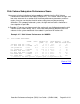
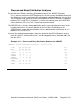
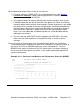
Process and Busy Distribution Analyses
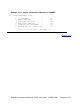
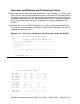
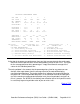
As you look at the Process and Busy Distribution Analyses for \NODEC (Example
4-11), you can see that the SYSTEM processes are fairly evenly distributed among the
four processors in the system but that the distribution could be improved. You can also
see a relatively large spread in the Busy Distribution for the SYSTEM class, especially
between CPU 1 and CPU 2. Example 4-11 shows that moving some of the SYSTEM
class‟s load from CPU 2 to CPU 1 would improve performance.
The SERVER class, the class doing application work, is evenly distributed in terms of the
number of processes. A closer inspection of the CPU Busy Distribution for the
SERVER class shows that the utilizations are less balanced with a difference of 11%
between CPU 2 and CPU 3.
A scan of the aggregate percentages shows the spread in total CPU utilizations varying
from 44% to 69%, and the total of 233% can be compared with an available 400% for
the four CPUs.
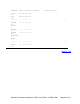
Example 4-11. Process and Busy Distribution Analyses for \NODEC
OVERVIEW Process Distribution Analysis - Process Counts
Class Cpu Cpu Cpu Cpu Tot
Name #00 #01 #02 #03 Cnt
-------- --- --- --- --- ----
SYSTEM 70 70 52 52 244
SUBSYS 14 13 3 2 32
PATHWAY 2 1 3 4 10
SERVER 71 71 65 69 276
TRANSIENT 5 5
OTHER 21 21 17 18 77
-------- --- --- --- --- ----
TOTAL 178 176 140 150 644