
Guardian Performance Analyzer (GPA) User Guide

Guardian Performance Analyzer (GPA) User Guide – (544541-006) Page 90 of 131
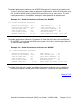
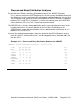
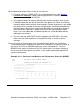
PROCESSOR PERFORMANCE CHART
CPU NUM : 0 1 2 3
CPU TYPE : TXP TXP TXP TXP
MB MEMORY: 8 8 8 8
PCT BUSY : 45.54 43.63 36.66 26.93
DISK PRIME : 5 0 4 0
DISK RATE : 11.9 13.3
CHIT RATE : 16.9 11.7
MSG RATE : 197 93 77 76
DISP RATE : 456.9 240.6 242.1 212.7
SWAP RATE : .01 .02 .02 .04
MMGR PAGES : 1715 650 625 1087
PCB COUNT : 84 87 77 84
TRANSIENTS : 5 3 3 8
HALT IMPACT: MEMORY NONE NONE NONE
CPU Count: 4 Avg CPU Busy (^): 38.1 Tuning Window (w): 8
PCB Count: 332 Node SWAP Rate : .09 VOLUME Count : 9
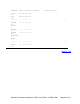
CPU FLAG EXPLANATIONS: + - Interrupt Busy
M - Severe Memory Shortage m - Mild Memory Shortage
P - Severe Transient Processing p - Mild Transient Processing
B - Severe Transients/Memory Shortage b - Mild Transients/Mem. Shortage
Q - Moderate Memory Shortage R - Moderate Transient Processing
! - Processor MISSING From Measurement S - Moderate Transients/Mem. Short
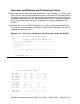
At the foot of the processor performance chart you find summary data for the entire node,
which for the most part are totals of the corresponding values for the CPUs. The figure
for the average processor busy percentage is simply the arithmetic average of the
values for the individual processors.
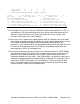
The tuning window is the amount that the percentage busy time for any processor can
deviate, either up or down, from the average value for the node without being
considered out of balance. The tuning window thus indicates the target utilization for
the processor. The tuning window decreases as the utilization level of the node goes
up. At the maximum recommended utilization level, the tuning window is only plus or
minus 1 percent. For \NODEA, the relatively low utilization level of 36.2 percent results
in a relatively large tuning window value of plus or minus 8.0%.
[Back to TOC]