
Guardian Performance Analyzer (GPA) User Guide

Guardian Performance Analyzer (GPA) User Guide – (544541-006) Page 91 of 131
Disk Volume Performance Analysis
To track the performance of the disk volume subsystem, you look at the Disk Volume
Performance section (Example 4-14). Here you can see how the volumes are
configured with respect to primary and backup CPUs as well as primary disk
controllers. You can also see how the volumes compare with regard to a number of
performance parameters. These include request queue time, percentage busy times
for the corresponding disk device and disk I/O process, request rate, cache hit
percentage, and cache calls per request.
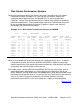
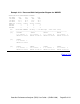
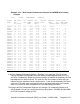
Example 4-14. Disk Volume Performance Analysis for \NODEB
DISK VOLUME PERFORMANCE ANALYSIS
VOLUME UNT CPU(S) CTL REQUEST AVG PROCESS REQUEST CACHE CACHE
NAME NOS NUM QUEUE DEVICE BUSY% RATE HIT% CALLS PER
P:M PC:BC TIME BUSY% /SECOND REQUEST
-------- --- ----- --- ------- ----- ------- ------- ----- --------
$SYSTEM 0:1 0: 1 %01 0.00 0.11 9.29 78.39 99.8 0.0
$PRODl 0:1 0: 1 %11 1.13 1.47 4.46 35.23 96.4 0.1
$PROD4 2:3 0: 1 %01 39.31 12.84 9.74 8.49 83.8 1.6
$PROD3 0:1 2: 3 %21 60.08 10.93 6.90 6.09 77.9 1.5
$TEST3 2: 2: 3 %21 11.24 2.41 0.83 2.21 93.9 0.9
$PROD5 0:1 2: 3 %31 15.17 1.43 1.13 1.07 96.5 1.0
$PROD2 2:3 2: 3 %31 35.39 1.47 0.34 0.00 0.0 0.6
$TESTl 4: 0: 1 %01 115.42 0.44 0.21 0.00 0.0 0.0
$TEST2 2: 0: 1 %11 52.28 0.00 0.04 0.00 0.0 1.3
Notice in the example that among the volumes with significant activity (that is, a request
rate greater than zero) the volumes $PROD4 and $PROD3 show excessively high
request queue times of 39 and 60 milliseconds respectively. GPA considers any queue
time greater than 25 milliseconds to be excessive.
As the table shows, volumes $PROD4 and $PROD3 are also the most utilized, with far
greater device busy percentages (12.8 and 10.9 percent respectively) than all the
others. However, the high queue times are probably due in large part to the poor cache
performance for these two volumes. As you can see, they show relatively low cache hit
rates of 83.8 and 77.9 percent respectively. GPA further analyzes the cache
performance for all volumes in the next section of its report, as described below.
[Back to TOC]