
Guardian Performance Analyzer (GPA) User Guide

Guardian Performance Analyzer (GPA) User Guide – (544541-006) Page 94 of 131
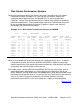
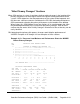
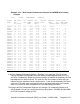
Processor/Disk Configuration Diagram
The processor/disk configuration diagram represents the physical configuration of the
system and lets you see quickly how the disk processing load is distributed over the
node (Example 4-17 AND Example 4-18).
In the examples for \NODEA and \NODEB, you can see immediately that CPUs 0 and 2,
as the primary processors for all volumes on the node, are carrying virtually the entire
load on each system. And in case of \NODEA (Example 4-17), the diagram shows a
severe memory shortage for CPU 0.
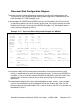
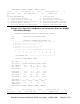
Example 4-17. Processor/Disk Configuration Diagram for \NODEA
PROCESSOR/DISK CONFIGURATION DIAGRAM
1
CPU GRID [00] [01] [02] [03]
2
CPU TYPE TXP TXP TXP TXP
3
CPU BUSY 34.1 66.0 32.7 11.9
4
DP2 BUSY 20.3 30.7 18.4 5.5
MMGR PGS 8000 58000 513000 1475000
6
NUM DP2 4 4 5 5
7
NUM PRI 4 0 5 0
8
NUM BKP 0 4 0 5
CPU DISK PATH SUMMARY (DP Busy % / DP Mem Pages / Disk Cache Calls)
----- ------------------------------------------------------------------------
9
[00] $SYSTEM $CL0 $DRIVER $B40
10
7.2/ 824000/ 13 2.6/ 227000/ 4 0.8/ 188000/ 1 0.1/ 84000/ 0
1
GMS110.03.003>01 GMS111.02.001>01 GMS111.02.002>01 GMS111.02.003>01
[02] $NSMS $PROJEC $XPRESS $MEAS
10
14.7/1225000/ 5 6.3/ 257000/ 1 1.7/ 295000/ 1 0.5/ 209000/ 0
11
GMS110.03.003>03 GMS111.02.001>03 GMS111.02.002>03 GMS111.02.003>03
[02] $X42
10
0.5/ 211000/ 0
11
GMS110.03.004>03
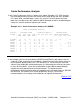
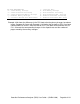
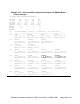
You can also readily tell from the diagram what portion of any given processor‟s total
activity is accounted for by each volume on the processor. In the case of \NODEB, for
example, it is easy to see that volumes $PROD4 and $PROD3, with Disk Cache Calls
request rates of 14 and 9, account for the Disk most activity on their respective
processors.
The configuration diagram also shows the backup path for each volume. In the example,
you can see the direction of the arrowheads that all the volumes with CPU 0 as the
primary processor are backed up on CPU 1 and all volumes with CPU 2 as primary are
backed up on CPU 3.