
Introduction to NonStop Operations Management

Operations Documentation
Introduction to NonStop Operations Management–125507
4-10
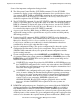
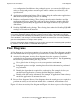
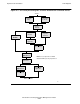
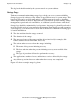
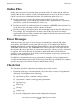
Flow Diagrams
Figure 4-3. An Activity Flow Diagram: Activities Performed in a 24-Hour Period
START
Load Bonds
Rates
Get Controller's
Go Ahead
System
Resource
Clear Up
Check
Inspection
Terminals
Release
BATCH1
Release
BATCH2
Start DEALER
Application
Open Network
Start
Application Y
Respond to
Close Event
Stop DEALER
Application
Stop
Application Y
Close Network
BACK TO START
Bold
items are dependent on TRADE
INSTRUCTIONS posted by Department Y
014