
iTP Secure WebServer System Administrator's Guide (iTPWebSvr 5.1+)
Managing the iTP Secure WebServer From Your
Browser
iTP Secure WebServer System Administrator’s Guide—522659-001
12-12
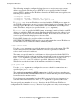
View EMS Logs
•
Enter display options:
The number of events to display cannot exceed 9999. The default value is 10.
The time order determines whether messages are displayed with the most recent first
or the oldest first. By default, messages are displayed in descending order by
timestamp (most recent first).
The timeout determines how long to wait since the last received message before
completing the request. The range is 0 to 9999. The default value is 20 seconds.
The stop at EOF option determines whether the request will complete at the end of a
log file. If this option is off, the program waits for another message until the timeout
is exceeded. This setting applies only if the time order is ascending.
The line-size option specifies how many characters of each message the web client
should display before wrapping to the next line. Use this option to control the
amount of message text you can see without having to use horizontal scrolling.
The indentation option lets you specify how much the second and subsequent lines
of each event message should be indented with respect to the first line, which
always starts in the first column.
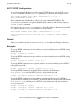
What You Do
Enter the criteria, and click on one of the following selections:
•
The Submit button to initiate the operation
•
The Reset button to return to the values originally displayed on this screen
•
The Help button for more explanation of the items on this screen
For a simplified set of options restricted to monitoring events as they occur, select
Operational View.
You may specify any combination of filter file, filter criteria, and search string. The
order of precedence among these items is as follows:
1. Filter file
2. Filter criteria
3. Search string
What Happens Next
After you click the Submit button, you will see a list of messages, one line for each
message. Each line displays the time the event was reported, the name of the process
that reported the event, the name of the subsystem, the event number, and the message
text. On a color monitor, critical events are red, and non-critical events are green.
(Critical events also are marked with asterisks.) You can scroll sideways to see more of
the text.