
LAN Configuration and Management Manual

SCF Commands for the SLSA Subsystem
LAN Configuration and Management Manual—520469-012
4-86
STATS PIF Command
STATS PIF Display
Displays are slightly different for most adapters.
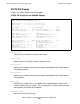
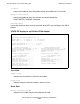
STATS PIF Display for an ATM3SA Adapter
Sample Time
indicates the time when the statistics were taken.
Reset Time
indicates when the statistics counters were last reset.
DFC Events
indicates the number of times data has been forwarded based on Data Forward
Count being reached.
DFT Events
indicates the number of times data has been forwarded based on Data Forward
Time expiration.
Exec Rate
indicates the number of times the adapter has completed processing the main
execution loop in the last second. This can be used as a guide to determine the
relative processor loading of the adapter.
Exec Rate HWM
High water mark for Exec Rate.
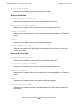
-> stats pif $zzlan.a0154.0.A
SLSA Stats PIF \SYS.$ZZLAN.A0154.0.A
Sample Time......31 Jul 2001, 12:45:36.155
Reset Time.......30 Jul 2001, 14:26:05.772
DFC Events...............60587 DFTEvents................7614
Exec Rate (per sec)......52575 Exec Rate LWM............45462
Service Time (usec)......42 Service Time HWM.........32516
TNet Halt 0..............0 TNet Halt 1..............0
TNet Link Exception 0....0 TNet Link Exception 1 0
TNet Packet Exception 0..0 TNet Packet Exception 1..0
TNet Timeout.............0 TNet Nack................0
Cells Received...........15389 Cells Transmitted........10569
Cells Dropped............0 Frames Dropped...........0
Congestion...............0 Free Buffer Underflow....0
Fifo Overrun.............0 Max Length Error.........0
CRC Error................0 User Abort...............0
Length Error.............0 T1 Abort.................0
Channel Deactivate.......0 Raw CRC Error............0