
Measure Reference Manual


number
is a number in the range 0 through 999999999999.999. The default is 0.
SCALE-TO number
sets the upper boundary of the data-value axis.
number
is a number in the range 0 through 999999999999.999. The default is 100.
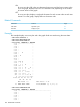
TIME-BASE { ON | OFF }
displays a bar graph or a two-axis plot of counter values. If a time interval was specified
when the data was collected, the default is TIME-BASE ON. Otherwise, the default is
TIME-BASE OFF.
ON
displays a plot of counter values over time.
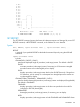
OFF
displays a bar graph of average counter values.
TO [ date , ] time-of-day ]
specifies the end of the plot window. TO and FOR are mutually exclusive. This attribute
becomes the default for subsequent plots until changed by a new SET PLOT or RESET PLOT
command.
date
is the end date of the plot in one of these formats:
{ [d]d mmm[ yyyy] }
{ mmm [d]d[ yyyy] }
where
dd is a day of the month, a number in the range 1 through 31.
mmm is the first three letters of the month; for example: JAN, MAR, OCT.
yyyy is the year. Valid years are 1984 through 2047.
If you omit date, the measurement end date is used.
time-of-day
is the end time of the data to be used for the plot, in the format:
hh:mm[:ss]
where
hh is the hour (0 through 23).
mm is minutes (0 through 59).
ss is seconds (0 through 59).
If you omit time-of-day, the measurement end time is used.
VERT-BASE { ON | OFF }
controls the display of the time axis. The default is ON.
ON
for a two-axis plot, displays time on the vertical axis. For a bar graph, displays the
bars horizontally (base on the vertical axis).
OFF
for a two-axis plot, displays time on the horizontal axis. For a bar graph, displays the
bars vertically (base on the horizontal axis).
WIDE-ITEM { ON | OFF }
sets the density of the plot. The default is OFF.
SET PLOT 107