
Measure Reference Manual


ON
for a two-axis plot, fills in the area between the time axis and the lowest counter value.
For a bar graph, displays bars two to six characters wide, depending on the number
of counter values on the graph.
OFF
for a two-axis plot, displays a single plot character for each counter value at each time
interval. For a bar graph, displays bars one character wide.
Related Commands
PageFunctionCommand
47Specifies a plotADD PLOT
82Displays a plotLIST PLOT
Example
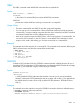
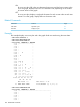
This example displays a two-axis plot and a bar graph. Both were made using the same data.
+ SET PLOT SCALE-TO 8
+ SET PLOT VERT-BASE OFF
+ SET PLOT WIDE-ITEM ON
+ LIST PLOT, INTERVAL 1 MINUTE
7.99 -------------------
7.62 - -
7.26 - -
6.90 - -
6.53 - -
6.17 - -
5.81 - B -
5.45 - -
5.08 - B -
4.72 - -
4.36 - -
3.99 - -
3.63 -B A A -
3.27 - * * -
2.90 - * * B -
2.54 -A * * -
2.18 -* * * A B -
1.82 -* * * * B -
1.45 -* * * B * -
1.09 -* * * * B A -
.726 -* * * A * * -
.363 -* * * * * A * A -
0 -*-*-*-*-*-*-*-*-A-
11:43:14 45 47 49 51
44 46 48 50
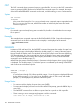
Min Value = 0 Max Value = 5.86
A: READ-BUSY-TIME Disk $BOOKS1 (6, 1, 17, 1)
B: READ-BUSY-TIME Disk $BOOKS1 (6, 1, 17, 2)
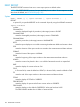
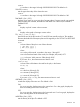
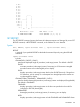
+ SET PLOT TIME-BASE OFF
+ LIST PLOT, INTERVAL 1 MINUTE
7.99 -----------------------------------------
7.62 - -
7.26 - -
6.90 - -
6.53 - -
6.17 - -
5.81 - -
108 MEASCOM Commands