
Measure Reference Manual


1 Introduction to Measure
The Measure performance monitor is a tool that collects performance statistics about system
resources. It lets you gather data from system components, network components, and your own
business applications. You can use the data to balance and tune your system, detect bottlenecks,
balance workloads, and do capacity planning. Multiple users can run Measure sessions at the
same time, and each user can configure and take measurements independently.
Operational Overview
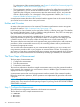
Figure 1 shows the major components of the Measure performance monitor: the Measure subsystem,
the user interface, and the subsystem instrumentation.
Figure 1 Operational Overview of the Measure Performance Monitor
NOTE: For NSMA systems, Figure 1 would show one MEASIP process per IPU, with MEASIP
process names of the form "$XPnna," where nn is the CPU number (00-15) and a is a letter
denoting the IPU number, starting with "A" for IPU 0.
The Measure Subsystem
The Measure subsystem must be running before any measurement can be made. Starting the
subsystem requires a super-group user (a member of user group 255). The subsystem has minimal
impact on performance. It can be started and allowed to run continuously. In some installations,
an operator starts the subsystem as part of the system-load operation.
The User Interfaces
The Measure performance monitor provides two interfaces:
• The command interface is a set of commands you can enter at the terminal or input from a
file. Each command calls a procedure, and each procedure performs a function such as
configuring a measurement, starting the measurement, displaying collected data, and so on.
Operational Overview 29