
Measure Reference Manual


Other output options exist as well. If you specified a measurement interval, you can examine the
counter values taken at each interval, in addition to the final values. You can display uninterpreted
values—that is, values that are not converted to percentages—and you can choose between a full
report and an abbreviated report.
For most entity types, you can also view counter values while the measurement is in progress.
When a measurement is complete, you can display one or more counter values as a plot. The plot
provides a graphical view that makes the values easier to analyze. To identify a counter to be
plotted and create the plot:
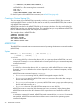
6+ ADD PLOT CPU-BUSY-TIME
7+ LIST PLOT
0::::::+:::20.0::::::+:::40.0::::::+:::60.0::::::+ ...
A ************************|
B ***********|
0::::::+:::20.0::::::+:::40.0::::::+:::60.0::::::+ ...
Min value = 16.036 Max value = 34.827
A: CPU-BUSY-TIME Cpu 5
B: CPU-BUSY-TIME Cpu 6
The resulting plot shows the CPU-BUSY-TIME counter values from the two measured CPUs. This plot
is in bar-graph format, with each counter value represented by a horizontal row of asterisks. You
can also use a two-axis format in which one axis represents counter values and the other axis
represents time intervals. For either type of plot, you can change the orientation (horizontal or
vertical), the scale of values, and the time window of the plot.
Considerations When Starting and Stopping Measurements
Although overall, consumption of system resources during measurements is not noticeable, there
are bursts of CPU and disc activity that may be noticeable when measurements are started or
stopped or when interval records are written.
To prevent this issue, avoid configuring measurements that start at the same time as another
measurement stops or writes interval records by using the steps that follow:
1. Start a MEASCOM session and enter the STATUS MEASSUBSYS command (prompt 1 in
Example 1) to list the measurements that are running (active) on the system.
In Example 1, the active measurements are MDFGUEST, DOFF3 and MCP.
2. Add the measurements (prompts 2, 3 and 4 in Example 1) and enter the INFO * command
(prompt 5 in Example 1) to see which of the measurements have intervals configured.
In Example 1, the output of the INFO * command shows that both MDFGUEST and MCPU
are configured with intervals of 10 seconds and that their start times (the first sample times)
are 14:00:57 for MDFGUEST, and 11:55:35 for MCPU. Each subsequent sample time is a
multiple of Interval from the start time, so you can predict that MDFGUEST will write out interval
data on the 7th second and that MCPU will write out interval data on the 5th second.
But what if the interval is some odd number, such as 17 seconds, and the start time was many
hours in the past?
In this case, start a MEASCOM session on the active measurement (prompt 1 in Example 2)
and enter a LISTALL command, specifying a recent time in the FROM option (prompt 2 in
Example 2) to see the current sampling times.
3. Use the FROM option in the START MEASUREMENT command to configure your new
measurement to start at a different start time and interval than the other active measurements.
For example, to avoid interval data being written at the same time as MDFGUEST and MCPU
in Example 1, you might specify your new measurement to start on the 1st second and to
specify an INTERVAL value of 10 seconds.
32 Introduction to Measure