
Measure Reference Manual


where
hh is the hour (0 through 23).
mm is minutes (0 through 59).
ss is seconds (0 through 59).
If you omit start-time-of-day, the start time of the measurement is used.
INTERVAL interval
specifies the time interval for the time line in the plot.
interval
is a time interval in one of these formats:
n SECOND[S]
n MINUTE[S]
n HOUR[S]
where n is an integer in the range 1 through 9999 and a multiple of the collection
interval specified when the data was collected.
If you omit INTERVAL, MEASCOM uses the collection interval specified when the data
was collected.
SCALE-FROM number
sets the lower boundary of the data-value axis.
number
is a number in the range 0 through 999999999999.999. The default is 0.
SCALE-TO number
sets the upper boundary of the data-value axis.
number
is a number in the range 0 through 999999999999.999. The default is 100.
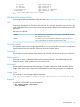
TIME-BASE { ON | OFF }
displays a bar graph or a two-axis plot of counter values. If a time interval was specified
when the data was collected, the default is TIME-BASE ON. Otherwise, the default is
TIME-BASE OFF.
ON
displays a plot of counter values over time.
OFF
displays a bar graph of average counter values.
TO [ end-date , ] end-time-of-day ]
specifies the end of the plot window. FOR and TO are mutually exclusive. If you omit both,
the window ends when the measurement or the entity measurement ends, whichever is
earlier.
end-date
is the end date of the data used for the plot, in the same format as start-date.
end-time-of-day
is the end time of the data used for the plot, in the same format as
start-time-of-day.
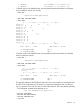
VERT-BASE { ON | OFF }
controls the display of the time axis. The default is ON.
ON
for a two-axis plot, displays time on the vertical axis. For a bar graph, displays the
bars horizontally (base on the vertical axis).
LIST PLOT 83