
Measure Reference Manual


D: REQUESTS Disc $SYSTEM-P (0, X, C1002531, 101)
E: REQUESTS Disc $DISC4-P (1, X, C1002531, 107)
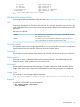
• To display a plot in the default format, assuming that the measurement data was collected
using a collection interval of 4 seconds:
+ LIST CPU *
.
. (reports for CPUs appear here)
.
+ ADD PLOT CPU-BUSY-TIME
+ LIST PLOT
0::::::+:::20.0::::::+:::40.0::::::+:::60.0 ...
14:28:19 - B A
14:28:23 - B A
14:28:27 - B A
14:28:31 -B A
14:28:35 - B A
14:28:39 -B A
14:28:43 -B A
14:28:47 - B A
14:28:51 -B A
14:28:55 -B A
14:28:59 -B A
14:29:03 -B A
14:29:07 - B A
0::::::+:::20.0::::::+:::40.0::::::+:::60.0 ...
Min. value = 2.000 Max value = 88.000
A: CPU-BUSY-TIME Cpu 6
B: CPU-BUSY-TIME Cpu 7
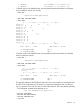
• To display a plot in the default format, assuming that the measurement data was collected
without a collection interval:
+ LIST CPU *
.
. (reports for CPUs appear here)
.
+ ADD PLOT CPU-BUSY-TIME
+ LIST PLOT
0::::::+:::20.0::::::+:::40.0::::::+:::60.0 ...
A ************|
B ***|
0::::::+:::20.0::::::+:::40.0::::::+:::60.0 ...
Min. value = 2.000 Max value = 88.000
A: CPU-BUSY-TIME Cpu 6
B: CPU-BUSY-TIME Cpu 7
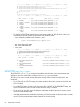
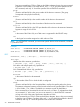
• This example displays a PROCESSH plot that shows how many samples of accelerated code
and TNS code were measured. The asterisk (*) represents accelerated code, and the plus
sign (+) represents TNS code. The plot also shows the results for TNS code plotted separately.
+ LIST PROCESSH $SYSTEM.SYS02.MEASCOM (UC.0)
.
. (report for PROCESSH entity appears here)
.
+ ADD PLOT CODE-RANGE
+ ADD PLOT TNS-BUSY-SAMPLES
+ SET PLOT TIME-BASE OFF
+ LIST PLOT
LIST PLOT 85