
Measure User's Guide

Formatting Reports and Plots
Measure User’s Guide—520560-003
4-8
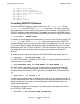
Displaying Interpreted and Uninterpreted Values
Displaying Interpreted and Uninterpreted Values
You can display interpreted or uninterpreted counter values in reports:
•
Interpreted values are raw counts divided by delta-time per second. Interpreted
values are particularly useful for making relative comparisons of data.
•
Uninterpreted values are actual counts taken during the measurement period.
Uninterpreted values are particularly useful for determining the time needed to run
a process or application, how often an event occurs over the life of a process or
application, and so on.
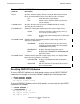
To display interpreted values, set REPORT RATE ON (the default). To display
uninterpreted values, set REPORT RATE OFF.
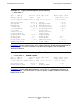
Example 4-4
shows uninterpreted counter values displayed for CPU 1 of a TNS VLX
system. Compare this report with the report in Example 4-3
on page 4-8, which shows
interpreted values (for a different measurement).
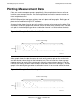
The REPORT RATE attribute also determines whether plots contain interpreted or
uninterpreted values. For information on creating plots, see Plotting Measurement Data
on page 4-10.
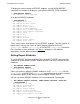
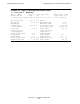
Example 4-3. Setting a Report Window
11+ LIST CPU 1, FROM 11:30, TO 12:00
Cpu 1 NSR-L Initial Lock Pgs 2048 Mem Pages 8192
Memory MB 32 PCBs 256 Page Size 4096
Local System \SPAR From 17 Aug 2003, 11:30:00 For 30 Minutes
Cpu-Busy-Time 38.73 % Swaps 1.49
Cpu-Qtime 1.01 # Cpu-Qlen-Max 39 #
Mem-Qtime 0.13 # Mem-Qlen-Max 13 #
Dispatches 111.27 Intr-Busy-Time 6.16 %
Process-Ovhd 0.11 % Send-Busy-Time 0.64 %
Disc-IOs Cache-Hits
Transactions Response-Time
Page-Requests Page-Scans
Ending-Free-Mem 4092 Ending-UCME 0
Ending-UDS 500 Ending-SDS 1500
Ending-UCL 100 Ending-SCL 2000
Accel-Busy-Time 18.45 % Accel-Busy-Time 3.10 %
TNSR-Busy-Time 11.02 % Comp-Traps 9.07 #