
Measure User's Guide

Formatting Reports and Plots
Measure User’s Guide—520560-003
4-13
PLOT Attributes
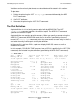
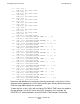
When the plot definition is redisplayed, the counter for CPU 0, associated with plot
character A, has been deleted:
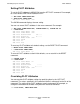
9+ INFO PLOT *
Add measurement $SPOOL.PERF.DATA1
--B-- List Cpu 1
Add plot CPU-BUSY-TIME
--C-- List Cpu 2
Add plot CPU-BUSY-TIME
.
.
.
--L-- List Cpu 11
Add plot CPU-BUSY-TIME
To delete all counters of the same type from a plot definition, use an asterisk in place of
the plot character. For example, this command deletes all entity-counter pairs defined
for CPU-BUSY-TIME from the plot definition:
8+ DELETE PLOT CPU-BUSY-TIME (*)
When you issue the LIST PLOT command after deleting entity-counter pairs, the pairs
are relettered sequentially beginning with the letter A. Even though you delete an
entity-counter pair from a definition, its letter can be reused in the plot display. A key
below the plotted data lists each plot character shown in the graph, its counter name,
and its entity specification. Use this key to identify the newly assigned plot characters.
(For examples of the key, see Generating Plots on page 4-16.)
PLOT Attributes
With PLOT attributes, you can control the format of the graphic displays generated by
the LIST PLOT command.
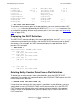
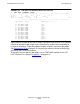
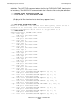
To display the current settings of PLOT attributes, enter the SHOW PLOT command:
5+ SHOW PLOT
Set Plot Vert-Base on
Set Plot Time-Base
Set Plot Scale-From 0.000
Set Plot Scale-To 100.000
Set Plot Wide-Item off
Set Plot From
Set Plot To
Set Plot For
These values are the initial defaults of the PLOT attributes. They are used for all data
plots unless you set new values or specify different attributes in the LIST PLOT
command. When you select a new data file using the ADD MEASUREMENT command
or exit from MEASCOM, the PLOT attributes return to their default settings. For a
summary of PLOT attributes, see Table 4-2 on page 4-14. For detailed descriptions,
see the Measure Reference Manual.