
Measure User's Guide

Formatting Reports and Plots
Measure User’s Guide—520560-003
4-14
PLOT Attributes
Note. To select interpreted or uninterpreted counter values for plotting, you must set the
REPORT RATE attribute. If REPORT RATE is ON, interpreted values are plotted when you
issue the LIST PLOT command. If REPORT RATE is OFF, uninterpreted values are plotted
when you issue the LIST PLOT command. For more information about the REPORT RATE
attribute, see Displaying Interpreted and Uninterpreted Values on page 4-8.
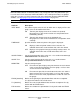
Table 4-2. MEASCOM PLOT Attributes
Attribute Description
VERT-BASE For a two-axis plot, varies the axis on which time is displayed. For a bar
graph, varies the orientation of the bars:
ON Two-axis plot: displays time on the vertical axis (default).
Bar graph: bases bars on the vertical axis and positions them
horizontally (default).
OFF Two-axis plot: displays time on the horizontal axis.
Bar graph: bases bars on the horizontal axis and positions them
vertically.
TIME-BASE Specifies whether a two-axis plot or a bar graph is displayed:
ON Displays a two-axis plot of counter values over time. If a
collection interval was used to collect data, ON is the default.
OFF Displays a bar graph of average percentage counter values. If a
collection interval was not used to collect data, OFF is the
default.
SCALE-FROM n Sets the lower boundary of the value axis. n is a number from 0 through
999999999999.999. The default is 0.
SCALE-TO n Sets the upper boundary of the value axis. n is a number from 0
through 999999999999.999. The default is 100.
WIDE-ITEM Sets the density of a plot.
OFF For a two-axis plot, displays one plot character for each counter
value at each interval (default). For a bar graph, uses bars that
are one-character wide (default).
ON For a two-axis plot, fills the area between the time axis and the
lowest counter value. For a bar graph, uses bars that are from
two to six characters wide (adjusted to the number of values on
the graph).
FROM [date/time] Defines the beginning of a plot window. Date and time are optional.
Use by itself or with the TO or FOR clause.
TO [date/time] Defines the end of a plot window. Date and time are optional. Use by
itself or with the FROM clause.
FOR duration Defines the duration of a plot window. Use by itself or with the FROM
clause.