
Measure User's Guide

Formatting Reports and Plots
Measure User’s Guide—520560-003
4-26
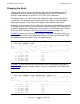
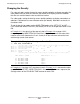
Changing the Density
Changing the Density
For a two-axis plot, setting the density means deciding whether to display one point for
each plotted value at each time interval (the default) or to display asterisks between
the time axis and the lowest value at each time interval.
For a bar graph, setting the density means deciding whether to display narrow bars or
wide bars. Narrow bars are one character wide (the default). Wide bars are two to six
characters wide.
To set the density for a plot, use the WIDE-ITEM option of the SET PLOT or LIST
PLOT command. WIDE-ITEM OFF (the default) fills in less of the plot than WIDE-ITEM
ON.
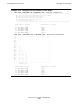
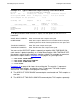
In Example 4-13, the density of the two-axis plot in Example 4-9 on page 4-22 is
changed by setting WIDE-ITEM ON. Each line in this plot represents the value of the
counter at the time shown on the Y axis. Asterisks fill the area from zero to the least
active entity at each time interval.
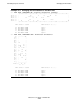
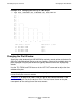
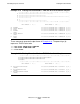
In Example 4-14 on page 4-27, the two-axis plot in Example 4-13 is converted to a bar
graph (TIME-BASE OFF). WIDE-ITEM ON is still in effect. The five bars represent the
average values of the CPU-BUSY-TIME counter for each CPU.
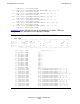
Example 4-13. Changing the Density of a Two-Axis Plot
62+ LIST PLOT, WIDE-ITEM ON
0:::::+:::20.0:::::+:::40.0:::::+:::60.0:::::+:::80.0:::::+::::100
11:20:00 *****************E D C B A -
11:50:00 ***************E C D A B -
12:20:00 **********B C E A D -
12:50:00 ****************E BD A C -
13:20:00 ****E C D A B
0:::::+:::20.0:::::+:::40.0:::::+:::60.0:::::+:::80.0:::::+::::100
Min value = 5.838 Max value = 100.000
A: CPU-BUSY-TIME Cpu 3
B: CPU-BUSY-TIME Cpu 1
C: CPU-BUSY-TIME Cpu 2
D: CPU-BUSY-TIME Cpu 10
E: CPU-BUSY-TIME Cpu 4