NonStop Cluster Performance Essentials User's Guide, Version 2.2

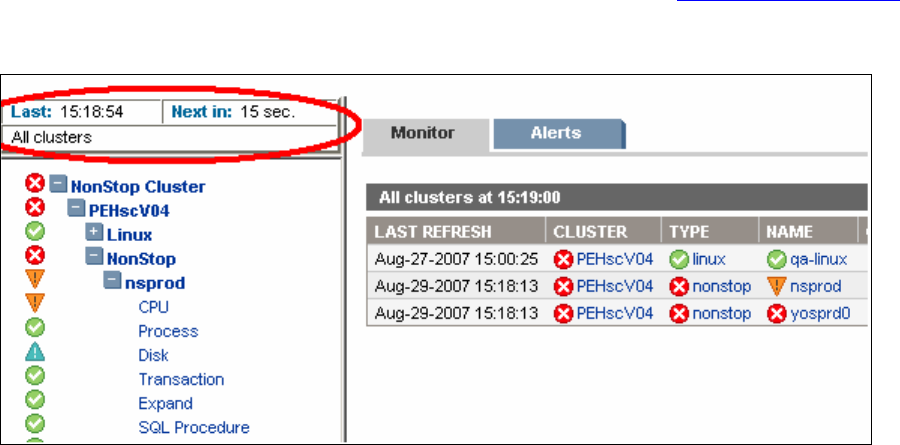
frame. A
simple table shows the time when this page was refreshed last, time in
second(s) remaining before the next refresh, and the current selected node in the
exploration tree. Like the Last Refresh time shown in the auto-refresh table, the Last
Refresh timestamps shown in the Monitor tab reflects the current PC time of the last
refresh interval. The time stamp of the last refresh is retrieved from the PC that SIM is
running from, so current PC time may differ from NonStop time as displayed on the
monitor tab.
Note that even though the refresh occurs every 30 seconds, the scheduler runs every
minute, so new data will not appear every 30 seconds; instead it will appear every
minute. Additionally, the auto-refresh is configurable; refer to Configuration Options
section for more details.
Figure 6 – Auto-refresh
In the above figure, the timestamp on the Monitor tab Label is determined by whether or
not the scheduler was able to retrieve fresh performance data. If the scheduler was able
to retrieve fresh data, this timestamp will reflect the time that all the data was retrieved
from the NonStop or Linux agent. If the scheduler was not able to retrieve data, this
timestamp reflects the current PC time; the time at which the scheduler tried to retrieve
fresh data. This Label is reflected in all tables on the Monitor tab. Below the auto-refresh
table, there is a drill-down exploration tree to make it easy for the user to view data on
clusters, nodes and entities. Selecting one of these items from the tree displays the
most current selected data on the right side of the monitoring page.
The right side of the performance monitoring page is a frame that contains two tabs:
Performance Essentials HP SIM Client and NonStop & Linux Host User Guide – 544813 – 004
41


