
NonStop Cluster Performance Essentials User's Guide, Version 2.2
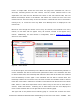
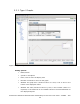
Displ
ay:
One line per object per interval
Objects identified on the legend
Controls:
Prev and Next buttons to move through available data
Pause/Resume switch button to allow the graph to refresh with the latest
data or pause at a static time interval.
Legend link to click on, in order to set the graph exclusively to that object.
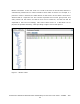
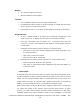
Graph behavior:
At first, a default graph of all objects for 4 intervals is displayed. If the
graph is left as is, it displays the new data as it becomes available.
User may also select only one object (e.g., a particular CPU) from the
“Only” list, or click on the legend for that object to set the graph exclusive
to that object.
Following actions/events place the graph in a “Paused” state:
o User clicks on the Pause button (displayed only when the graph is not
in a “Paused” state).
o User clicks on the “Prev” button.
o User sets the scale to “Displayed”
Following actions/events place the graph in an “Auto-refresh” state:
o When Trend Graph window is first opened.
o User clicks on the Resume button (displayed only when the graph is in
a “Paused” state).
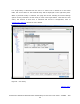
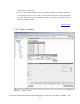
Initial Graph:
A selected entity may have more than one metric. The initial trend graph shows
the first metric for all objects with 10 intervals per page. Y-axis is set to scale to
100% for CPU and All Available data for Transaction with 0 floor value. The
graph shows the latest 10 intervals and refreshes itself every 30 seconds by
default. To select a different metric, use the Metric dropdown menu.
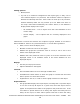
Note: Some metrics for the CLIM may have ‘negative’ values. This is so because
we report the change in the metrics’ value over the time interval, so these
metrics (e.g. UDP current sockets and TCP Current Connections for the entity
CIPMON) might have lesser numerical value at the completion of the time
Performance Essentials HP SIM Client and NonStop & Linux Host User Guide – 544813 – 004
46