
NonStop Cluster Performance Essentials User's Guide, Version 2.2
i
nterval than at the start.
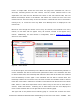
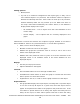
In such a case, where negative values are being reported, you might notice that:
a) If the Graph floor is set to "Zero", the negative value point will not be plotted.
b) If the Graph floor is set to "Minimum value", the graph will adjust itself to
show the negative values.
[Back to TOC]
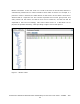
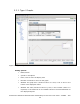
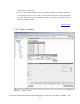
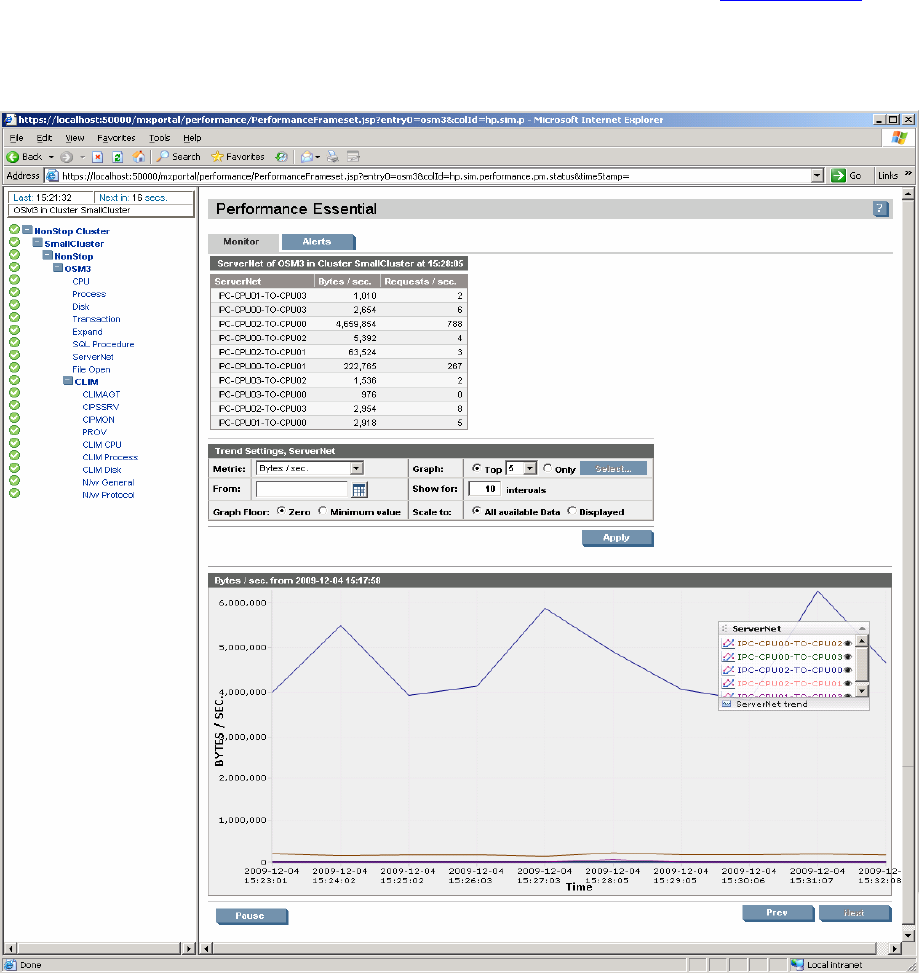
5.3.2. Type-II Graphs
Figure 10 – Type-II Graph
Performance Essentials HP SIM Client and NonStop & Linux Host User Guide – 544813 – 004
47