
NonStop S-Series Operations Guide (G06.24+)
Tools and Utilities for Operations
HP NonStop S-Series Operations Guide—522459-007
B-7
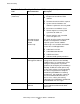
ViewPoint
you with the most complete view of the status of your NonStop S-series server and
allows you to perform many service operations. You can perform these tasks using the
TSM Service Application:
•
View a list of outstanding alarms
•
Power on or power off a disk
•
Perform an up or down action on a disk
•
Clear data on a disk
•
Update firmware on a group of service processors or a single service processor
•
Configure or update server information
The Management window of the TSM Service Application displays a tree pane, a view
pane, and a details pane:
•
The tree pane is located on the left side of the Management window and has two
tabs: the system tab (displaying the actual system name) and the Cluster tab. The
system tab depicts the NonStop S-series server and its groups, modules, and
resources in a hierarchy. From the Cluster tab, you can expand the ServerNet
Cluster icon to view information about the local system’s connectivity to other
nodes (systems) in the ServerNet cluster.
•
The view pane is located on the top right of the Management window. The view
pane includes a Physical view, Connection view, and Inventory view of a NonStop
S-series server.
•
The details pane is located on the bottom right of the window. It consists of an
Attributes tab and an Alarms tab. The Attributes tab lists the attribute name and
corresponding value of the group, module, or resource selected in the tree pane.
The Alarms tab lists the alarms for the resource selected in the tree pane.
The tree pane and view pane work together to demonstrate the relationship between
the physical location of a group, module, or resource, and its position in the hierarchy
of the NonStop S-series server.
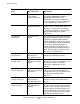
ViewPoint
Use ViewPoint to display event messages about current or past events occurring
anywhere in the network on a set of block-mode events screens. The messages can
be errors, failures, warnings, and requests for operator actions. The events screens
allow operators to monitor significant occurrences or problems in the network as they
occur. Critical events or events requiring immediate action are highlighted.
ViewSys
ViewSys is a system resource monitor that displays processor performance statistics
and resource consumption for a set polling period. It updates the numbers
automatically at the end of each polling period, which allows you to evaluate the effects
of changes as those changes are made. ViewSys indicates the current allocation of a