
NonStop S-Series Operations Guide (G06.29+)


Overview of Monitoring and Recovery
HP NonStop S-Series Operations Guide—522459-009
3-8
A Top-Down Approach to Monitoring and Resolving
Problems
including communications links and other objects and services that might be
contributing to the problem or affected by it.
For example, the OSM Service Connection or the TSM Service Application might
display an alarm for an Ethernet adapter. This information is valuable, but the problem
might not actually be with the adapter. By using SCF to examine status information
not only for the adapter but also for the SLSA subsystem, the WAN subsystem,
Expand, NonStop TCP/IP, the ServerNet fabrics, and so forth, you can determine
whether the adapter is, for example, simply generating errors because of a NonStop
TCP/IP problem.
To get comprehensive online descriptions of all the available SCF commands, use the
SCF HELP command.
The following subsections describe and illustrate how to use OSM or TSM and SCF to
monitor and resolve problems.
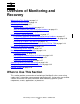
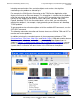
In addition to having the same basic panes in the management window as TSM
(Overview Pane, Tree Pane, View Pane, and Details Pane), OSM adds another feature
that allows you to check system health at a glance: the System Status Icon. As
shown in Figure 3-1, Green System Status Icon in OSM Service Connection, you can
quickly see by the green System Status Icon that no problems currently exist on the
system; there’s no need to drill down farther in the OSM tree or view panes.
Figure 3-1. Green System Status Icon in OSM Service Connection