
NonStop Server for Java 4.2 Programmer's Reference
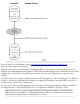

If you are using JDB on a different NonStop system from where the debuggee runs, use
jdb -attach host-name:portnum
●
If you are using JDB from Microsoft Windows or any other platform, use
jdb -connect com.sun.jdi.SocketAttach:hostname=hostname,port=portnum
●
Further Information
If you are using a GUI debugger, refer to the vendors' documentation to configure the debugger to communicate
with the debuggee.
Remote debugging NonStop Server for Java 4 applications has been tested with Borland JBuilder 8 and JBuilder 9.
For information on using Borland Builder, see JBuilder at the Borland web site
(http://www.borland.com/jbuilder/index.html). This website includes white papers
(http://www.borland.com/jbuilder/white_papers/) with additional information.
For more details on command-line options see Connection and Invocation Details
(http://java.sun.com/j2se/1.3/docs/guide/jpda/conninv.html).
Debugging JNI Code
To debug native code that the application writers wrote and linked with the Java program, use the inspect debugger
tool available on the NonStop system. On a TNS/R system use Inspect; for further information see the Inspect
Manual. On a TNS/E system, use Visual Inspect (the preferred debugger) or Native Inspect; for further
information, see the Native Inspect Manual.
You can use the following command to start java under an inspect debugger:
On TNS/R, run -debug -inspect=on java java_options
On TNS/E, run -debug java java_options
On the TNS/R platform, to debug native code, set an Inspect breakpoint on the routine to be debugged.
On the TNS/E platform, to debug native code, load the DLL first. Visual Inspect lets you stop the program after the
DLL is loaded so you can set breakpoints. To invoke the Native Inspect debugger, use the eInspect command.
You can see and debug only the native routine to be debugged and other native routines that that routine calls. All
other scopes above the native routine are compiled or interpreted Java code, which the inspect debugger has no
knowledge about.
Using Visual Inspect on TNS/E To Add an Event Breakpoint on DLL Open
Event
Because Visual Inspect does not support deferred breakpoints, you need ensure that a DLL is loaded before setting
a breakpoint. Visual Inspect supports the DLL Open event breakpoint that suspends the program just after a DLL is
loaded but before initialization routines are invoked.
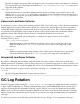
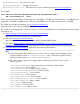
To add an Event Breakpoint on DLL Open event:
In Visual Inspect, choose View > Breakpoints in Application or Program Control view.1.
Click the Event tab.2.