
NonStop Server for Java 4.2 Programmer's Reference


Title Page | Contents | Index | Glossary | Prev | Next
Application Profiling
With a profiling tool, you can get information about your Java program's CPU usage, heap allocation, and
threads. Using this information, you can tune an application.
The tools supported by NonStop Server for Java 4 include:
Java Virtual Machine Profiler Interface (JVMPI) provides a profiler interface that tool vendors can use to
develop GUI tools for profiling Java programs. JVMPI is described in the Sun Microsystems
documentation for JVMPI
(http://java.sun.com/j2se/1.4.2/docs/guide/jvmpi/index.html).
●
HPROF Profiler Agent is a simple profiler agent shipped with the Java 2 SDK and, therefore included
with NonStop Server for Java 4.
●
Profiling NonStop Server for Java 4 programs is described in these topics:
Profiling Overview●
Using the HPROF Profile Agent●
Using HPjmeter●
Profiling Overview
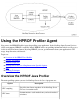
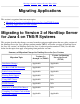
The JVMPI is a two-way, function-call interface between a Java virtual machine and an in-process profiler
agent. The profiling environment for NonStop Server for Java 4 programs is illustrated showing the HPROF
profiler agent writing output to a file.
Profiling Environment