
NonStop Server for Java Programmer's Reference (NSJ 4.0+)
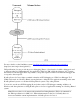
Table Of Contents
If you are using JDB on a different NonStop Kernel system from where the debuggee runs, use
jdb -attach host-name:portnum
●
If you are using JDB from Microsoft Windows or any other platform, use
jdb -connect com.sun.jdi.SocketAttach:hostname=hostname,port=portnum
●
Further Information
If you are using a GUI debugger, refer to the vendors' documentation to configure the debugger to
communicate with the debuggee.
Remote debugging NonStop Server for Java 4 applications has been tested with Borland JBuilder 8 and
JBuilder 9. For information on using Borland Builder, see JBuilder at the Borland web site
(http://www.borland.com/jbuilder/index.html). This website includes white papers
(http://www.borland.com/jbuilder/white_papers/) with additional information.
For more details on command-line options see Connection and Invocation Details
(http://java.sun.com/j2se/1.3/docs/guide/jpda/conninv.html).
Debugging JNI Code
You can use the Inspect debugger tool on a NonStop Kernel system to debug the native code that the
application writers wrote and linked with the java program. For information about Inspect, see the Inspect
Manual.
You can use the following command to start java under Inspect:
run -debug -inspect=on java java_options
Debugging Java and JNI Code
You can use Inspect debugger tool to debug the native code and the Java Debugger tool to debug the Java
code at the same time. You need to start the Java debuggee process under Inspect by using the following
command:
run -debug -inspect=on java -Xdebug -Xnoagent -Xrunjdwp:sub-options
Then, you can use the Java Debugger tool to communicate with the debuggee process as explained under
Debugging Overview.