
NonStop Server for Java Programmer's Reference (NSJ 4.2+)

Suspends the debuggee just before the main class loads.
Optionally, you can specify the -Xinit argument to specify using only the interpreter and not the HotSpot
compiler.
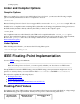
Starting the Java Debugger (jdb) Tool
Now, the Java Debugger (jdb) tool can be started to communicate with the debuggee by using the jdb command
as described for various situations.
If you are using JDB on the same NonStop Kernel system where the debuggee runs, use
jdb -attach portnum
●
If you are using JDB on a different NonStop Kernel system from where the debuggee runs, use
jdb -attach host-name:portnum
●
If you are using JDB from Microsoft Windows or any other platform, use
jdb -connect com.sun.jdi.SocketAttach:hostname=hostname,port=portnum
●
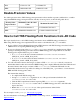
Further Information
If you are using a GUI debugger, refer to the vendors' documentation to configure the debugger to communicate
with the debuggee.
Remote debugging NonStop Server for Java 4 applications has been tested with Borland JBuilder 8 and JBuilder 9.
For information on using Borland Builder, see JBuilder at the Borland web site
(http://www.borland.com/jbuilder/index.html). This website includes white papers
(http://www.borland.com/jbuilder/white_papers/) with additional information.
For more details on command-line options see Connection and Invocation Details
(http://java.sun.com/j2se/1.3/docs/guide/jpda/conninv.html).
Debugging JNI Code
You can use the Inspect debugger tool on a NonStop Kernel system to debug the native code that the application
writers wrote and linked with the Java program. For information about Inspect, see the Inspect Manual.
You can use the following command to start java under Inspect:
run -debug -inspect=on java java_options
To debug native code, set an Inspect breakpoint on the routine to be debugged.
You can see and debug only the native routine to be debugged and other native routines that that routine calls. All
other scopes above the native routine are compiled or interpreted Java code, which the Inspect debugger has no
knowledge about.
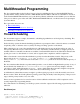
Debugging Java and JNI Code
You can use Inspect debugger tool to debug the native code and the Java Debugger tool to debug the Java code at
the same time. You need to start the Java debuggee process under Inspect by using the following command:
run -debug -inspect=on java -Xdebug -Xnoagent -Xrunjdwp:sub-options