
NonStop Server for Java Programmer's Reference (NSJ 4.2+)

Using the HPROF Profiler Agent
You can use the HPROF Profiler Agent for profiling your application. In the NonStop Kernel Open System
Services (OSS) environment, HPROF is statically linked. HPROF writes out profiling information either to a
file or to a socket in ASCII or binary format. By using HPROF, you can get information about your
application's CPU usage, heap allocation, and threads.
Topics are
Overview of the HPROF Java Profiler●
Running the HPROF●
HPROF Output File●
NonStop Server for Java 4 Implementation-Specific Options●
Tips●
Profiling Techniques●
Overview the HPROF Java Profiler
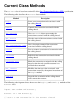
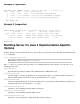
The main profiling options you use for NonStop Server for Java 4 programs are:
Option Description
CPU sampling
Specifies time-linear snapshots of the NonStop
Server for Java 4 execution stack.
CPU times
Instrumentation: track-method entry and
track-method exit times.
HEAP dump
Lists all live object instances in the heap. The
list can get very long.
HEAP sites
Lists the total allocations per class, array, and
so forth.
MONITOR contention Lists the times spent by waiting threads.
HPROF writes the information about the options to an output file in either ASCII or binary format. The default
name of the output file is:
java.hprof.txt
The file format is:
Standard HEADER, thread events, stack traces●
Ranked profiling output●
You can analyze output files by using such tools as the Heap Analysis Tool (HAT) and HPjmeter. See Using
HPjmeter for more information about the HPjmeter performance-analysis tool.