
Open System Services Porting Guide (G06.24+, H06.03+)
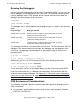
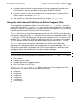

Table Of Contents
- What’s New in This Manual
- About This Manual
- 1 Introduction to Porting
- 2 The Development Environment
- 3 Useful Porting Tools
- 4 Interoperating Between User Environments
- Purpose of Interoperability
- The OSS User Environment
- OSS Commands for the Guardian User
- Guardian Commands for the UNIX User
- OSS Pathname and Guardian Filename Conversions
- Running the OSS Shell and Commands From TACL
- Running Guardian Commands From the OSS Shell
- Running OSS Processes With Guardian Attributes
- Using OSS Commands to Manage Guardian Objects
- 5 Interoperating Between Programming Environments
- 6 OSS Porting Considerations
- 7 Porting UNIX Applications to the OSS Environment
- 8 Migrating Guardian Applications to the OSS Environment
- General Migration Guidelines
- C Compiler Issues for Guardian Programs
- Using New and Extended Guardian Procedures
- Using OSS Functions in a Guardian Program
- Interoperating With OSS Programs
- Starting an OSS Program From the Guardian Environment
- C Compiler Considerations for OSS Programs
- Porting a Guardian Program to the OSS Environment
- How Arguments Are Passed to the C or C++ Program
- Differences in the Two Run-Time Environments
- Which Run-Time Routines Are Available
- Use of Common Run-Time Environment (CRE) Functions
- Replacing Guardian Procedure Calls With Equivalent OSS Functions
- Which IPC Mechanisms Can Be Used
- Interactions Between Guardian and OSS Functions
- 9 Porting From Specific UNIX Systems
- 10 Native Migration Overview
- 11 Porting or Migrating Sockets Applications
- 12 Porting Threaded Applications
- A Equivalent OSS and UNIX Commands for Guardian Users
- B Equivalent Guardian Commands for OSS and UNIX Users
- C Equivalent Inspect Debugging Commands for dbx Commands
- D Equivalent Native Inspect Debugging Commands for dbx Commands
- E Standard POSIX Threads Functions: Differences Between the Previous and Current Standards
- Glossary
- Index
The Development Environment
Open System Services Porting Guide—520573-006
2-18
Using the Debuggers With OSS Files
Using the Debuggers With OSS Files
Three interactive symbolic debuggers are provided to enable you to isolate
programming bugs quickly. They all provide features that help you shorten the
debugging phase of a project. The debuggers are Inspect, Native Inspect, and Visual
Inspect. The debugger you choose depends on several factors, including the platform
(TNS/R or TNS/E) on which your program is running, whether the program consists of
PIC or non-PIC, and whether you wish to debug from a client workstation or on the
NonStop server. The following table shows the debuggers and the type of programs
they support:
Inspect and Native Inspect have differing commands and syntax. They are both
command-line interactive symbolic debuggers. Visual Inspect provides a PC-based
graphical user interface, which lets you execute commands and control the debugging
session through pull-down menus and dialog boxes.
Additionally, the noft (TNS/R Native Object File Tool) and enoft (TNS/E native
Object File Tool) utilities can be used on native program files for debugging options not
available with the Inspect, Native Inspect, and Visual Inspect debuggers. See Using
the noft and enoft Utilities on Native Program Files on page 2-21.
The Inspect, Native Inspect, and Visual Inspect debuggers have several features in
common: they enable you to look at your program while it is running and to debug
multiprogram applications. They track each program separately, enabling you to debug
a multiprogram application as easily as a single-program application. (Native Inspect
provides only limited support for debugging multiple programs. See the Native Inspect
Manual for details.) They allow the state of processes being debugged to be saved to a
savefile. They provides source-level access or symbolic access to your program.
Visual Inspect provides the additional advantage of enabling you to debug programs
on multiple nodes while working from a client PC. Visual Inspect is the most intuitive
and easiest to use of the symbolic debuggers and is the preferred debugger in the
TNS/E native environment.
All three debuggers support the same set of high-level commands for all of the
languages, with minor variances for language-dependent extensions. Although the
functions and names of high-level commands are uniform across all supported
languages, the parameters of several of the commands are language-dependent.
This Debugger... Is Used to Debug These Programs
Inspect TNS/R native non-PIC
G-series TNS (Guardian and OSS)
H-series TNS (Guardian)
Native Inspect TNS/E native
Visual Inspect TNS/R native PIC
TNS/E native
G-series TNS (Guardian and OSS)
H-series TNS (Guardian)