
OSI/AS Configuration and Management Manual

Troubleshooting Guide
OSI/AS Configuration and Management Manual—424119-001
8-5
Using TRACE and PTrace Commands
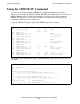
The following command displays information about only the TAPS subdevices
associated with the server $TAP1 that were created by local applications using the APPL
ENTRY object called MYAPP:
CHECK SU $TAP1.*, LOCALAPPL MYAPP, DISPLAY ONE
The following command displays information about all TSP subdevices associated with
the server $TSP1 that are in an error state and were created by the process $TAP1, and
all TAPS subdevices and NSP subdevices associated with those selected TSP
subdevices:
CHECK SU $TSP1.*, OPENER $TAP1, ERRORONLY
The following command displays information about all TSP subdevices in an error state
and opened by the process $TSP1, all TSP subdevices in an error state having a name
beginning with #SA and opened by the process $TSP2, and all TAPS subdevices and
NSP subdevices associated with those selected TSP subdevices:
CHECK SU (TSP1.*, $TSP2.#SA*), ERRORONLY
Using TRACE and PTrace Commands
The OSI/AS subsystem provides a trace facility to help you diagnose problems. The
trace facility consists of two parts:
•
SCF TRACE command
•
PTrace commands
Use the SCF TRACE command to trace OSI/AS subsystem activity. You can limit the
number of trace records you collect by using the TRACE command options.
Use the PTrace utility to format, display, and examine trace information collected by the
TRACE command. You can limit the information you format by using the options
provided in the PTrace SELECT and PTrace FILTER commands.
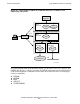
In addition to using the OSI/AS trace facility when troubleshooting, you may also need
to trace the process activities of underlying subsystems (OSI/TS, X25AM, and TLAM
or PAM). Figure 8-1
on page 8-6 shows how the SCF TRACE command and the PTrace
commands operate on all OSI processes.