
OSI/AS Configuration and Management Manual

Troubleshooting Guide
OSI/AS Configuration and Management Manual—424119-001
8-10
PTrace and Trace Analysis
PTrace and Trace Analysis
Although there is no tracing done of the API, you can trace the APS procedure calls as
seen by the TAPS process. Information is traced as it crosses the boundaries between the
layers. Therefore, you must trace whichever layer is appropriate to the problem.
To display your application requests and the TAPS responses and completions, you can
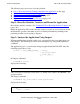
use the following sequence of PTrace commands to trace Layer 5:
SELECT L5
FILTER L5USER
FILTER NOL5PROV
An example is included in TAPS Process on page 8-16. Note that an error can occur in
Layer 6 or Layer 7 and be returned before Layer 5 sees the request and traces it.
API Troubleshooting Example
The following is an API problem that you may encounter. The steps in this example
illustrate the logic you might follow when using a top-down problem-solving approach.
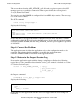
Symptoms
An application fails to get a session connection. An error is returned on the first call to
APS_ASSOC_ATTACH_.
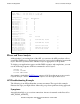
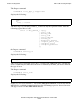
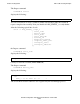
OSIAS Stats SUBSYS \MARS.$OMGR
Reset Time..... 15 Oct 1991, 10:00:36.074
Sample Time.... 15 Oct 1991, 10:03:55.258
Configuration:
Current Maximumever
TAPS Process... 2 2
TSP Process.... 2 2
NSP Process.... 4 4
APPL Entry..... 4 4
TSEL Entry..... 4 4
NSAP Entry..... 4 4
SNPA Entry..... 4 4
L3 Profile..... 2 2
L4 Profile..... 2 2
L5 Profile..... 2 2
Register Requests:
Received....... 13D
Succeeded...... 13D Failed 0D
Failure Reasons:
Loc Name Not Found. 0D Rem Name Not Found 0D
Loc TSEL Not Found. 0D
Loc NSAP Not Found. 0D Rem NSAP Not Found 0D
Loc SNPA Not Found. 0D
NSP Not Started.... 0D
TSP Not Started.... 0D TSP ADD SU Failed 0D
TAPS Not Started... 0D TAPS ADD SU Failed 0D
L3 Prof Not Found.. 0D L4 Prof Not Found 0D
L5 Prof Not Found.. 0D
Internal Error..... 0D