
OSI/AS Configuration and Management Manual

Troubleshooting Guide
OSI/AS Configuration and Management Manual—424119-001
8-36
PTrace and Trace Analysis
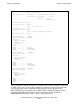
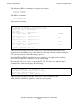
The following command displays information on the TPDUs transferred through a
specific subdevice:
STATS SU $TSP2.#Z000001
PTrace and Trace Analysis
The following PTrace commands are highly useful for obtaining Transport Layer
information. The order of the items roughly follows a top-down troubleshooting method.
Attach requests from TAPS processes are WRITEREAD calls to a TSP subdevice, with
the MCW set to signify a specific operation.
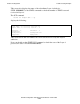
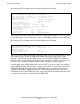
You can use the following command to display these calls:
SELECT MSG; FILTER MSGSYS
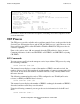
The screen returned displays the file-system call information. An MCW of %H8000
(bottom line) sets the TSP to accept an incoming T-CONNECT, as follows:
The following command displays the file-system calls from a specific subdevice:
SELECT MSG; MSGSU #Z000006
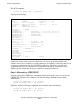
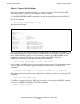
Errors are returned to the TAPS process when the TSP subdevice detects an error. The
following command finds a specific error, such as error 140:
FIND “FE: 140”
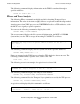
The following screen is an example of a typical received error 140:
The following command displays the transport state machine:
SELECT L4; FILTER L4SM; STATETABLES OS4SMT
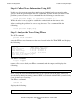
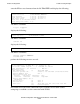
The following command lists the Transport Layer primitives traced by the TSP process:
SELECT L4; FILTER L4SERVICES; NEXT
A typical record displayed by this command is as follows:
17:11:52:920 >000.010 #17 Msg IO
WRITEREAD Req Tag: 1 File: 4 Syncid: 1 Wrlen: 2 Rdlen: 34 SU: #Z000006
P1: -32768
000: 8000
17:11:53:810 >000.000 #63 Msg IO
WRITEREAD Res Tag: 1 Replylen: 2 FE: 140 SU: #Z000006
17:11:52:960 >000.040 #19 T-Primitive
T-CON attach BufLen: 0 Addr: 1930676 SU: #Z000006