
OSI/AS Configuration and Management Manual

Troubleshooting Guide
OSI/AS Configuration and Management Manual—424119-001
8-37
Troubleshooting Example
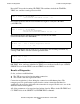
You can check specific TPDUs by specifying them in the FILTER command. The
following command specifies all CR-TPDUs, DR-TPDUs, and ER-TPDUs:
SELECT L4; FILTER TPDU CR, DR, ER
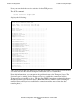
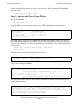
The following command lists the Network Layer primitives traced by the TSP process:
SELECT L3; FILTER L3SERVICES
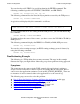
A typical record displayed by this command is as follows:
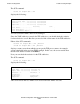
If you determine that errors are coming from the NSP process, you can find them using
the command:
SELECT NETIO; FILTER NETIOMSG
To further analyze the cause of these errors, you have to trace the X25AM or TLAM (or
PAM) process.
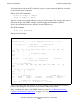
The following command displays the IPPDUs for TLAM (or PAM) NSP processes:
SELECT L3; FILTER IPPDU
You can also select routing messages (an ES-IS routing exchange protocol feature) by
using the following command:
SELECT L3; FILTER RTPDU
Troubleshooting Example
The following is a TSP problem that you may encounter. The steps in this example
illustrate the logic you might follow when using a top-down problem-solving approach.
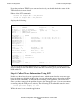
Symptoms
The symptoms are the same as in the TAPS example: this application is waiting to
accept a session connection. Connect requests are coming into the subsystem, but for
some reason, the application continues to wait in APS_EVENT_RECEIVE_. There are
no instances of errors returned, either to the application or to the console log.
The following steps are used to solve this problem:
•
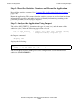
Step 1: Reset the Statistics Counters and Rerun the Application on this page
•
Step 2: Analyze the Application Using Inspect on this page
•
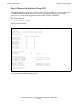
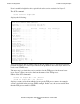
Step 3: Review the Statistics Using SCF on page 8-39
•
Step 4: Collect Trace Information Using SCF on page 8-44
•
Step 5: Analyze the Trace Using PTrace on page 8-45
•
Step 6: Correct the Problem on page 8-49
17:11:53:780 >000.000 #44 L3 Primitive
N-DATA indication NCB Index: 0 Buflen: 30 Addr: 1929808 SU: #TSP1004