
OSI/AS Configuration and Management Manual

Troubleshooting Guide
OSI/AS Configuration and Management Manual—424119-001
8-40
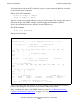
Troubleshooting Example
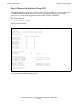
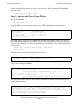
Now it would be helpful to take a quick look at the service statistics for Layer 5.
The SCF command
stats service $tap2.#l5
displays the following:
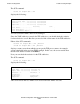
This screen shows that no SPDUs arrived into the TAPS process. This implies that the
problem originates in a lower layer. Because the problem is in a lower layer, there is no
need to run a TAPS trace.
The next step is to check the service statistics for the TSP process in the next lower
layer, Layer 4. First you need to find out the name of the TSP process.
Either of the SCF commands
status su $tap2.#Z000022 ,detail
check su $tap2.#Z000022 ,detail
displays a status screen from which you can get the TSP process name. An example
screen is included in the previous TAPS example. In this case, the screen would show
that the TSP process name is $TSP2.
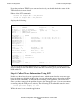
OSIAS Stats SERVICE \MARS.$TAP2.#L5
Resettime........... 15 Oct 1991, 4:16:32.629
Sampletime.......... 15 Oct 1991, 4:17:22.069
Refuse SPDUs: Received Threshold Sent Threshold
No reason................ 0 -- 0 --
Permanent................ 0 0 0 0
Temporary................ 0 0 0 --
Other.................... 0 -- 0 --
Abort SPDUs:
No reason................ 0 -- 0 --
Protocol Error........... 0 -- 0 0
Other.................... 0 -- 0 --
Connect SPDUs............ 0 0
Accept SPDUs............... 0 0
Disconnect SPDUs........... 0 0
Not Finished SPDUs......... 0 0
Finish SPDUs............... 0 0
Total Refuse/Abort SPDUs... 0 0
Total SPDUs................ 0 0
Total SPDU Bytes........... 0 0
Total Data Bytes........... 0 0
Subdevice Summary:
Attach pending SUs...... 0
Active connection SUs... 0
Inactive (static) SUs... 20
Available SUs........... 100