
OSI/AS Configuration and Management Manual

Troubleshooting Guide
OSI/AS Configuration and Management Manual—424119-001
8-42
Troubleshooting Example
You should now look at the X.25 statistics to prove your conclusion. But first you need
to find out the name of the line.
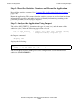
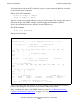
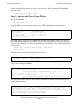
Either of the SCF commands
status su $tsp2.* ,detail
check su $tsp2.* ,detail
displays a status screen from which you can get the line name. The screen is the same as
shown in the previous TAPS example, and shows that the line name is $X252.
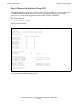
Now you can check the service statistics for that TSP process.
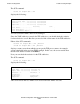
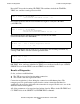
The SCF command
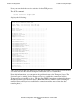
stats line $x252,sub
displays the following:
This screen shows that data packets are being exchanged. This information definitely
points to the Transport Layer as the source of the connection problem.
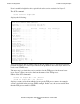
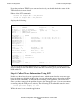
Since you know the name of the TAPS subdevice from Step 1: Reset the Statistics
Counters and Rerun the Application on page 8-38, you can check the statistics of the
subdevice.
X25AM STATS Line $x252
Resettime 4:16:51.097 10/16/91 Sampletime 4:17:42.081 10/16/91
Line Quality 100 Modem Error 0 Modem Overrun 0
[ Packet Level Information ]
Data Call Clear Reset Rstrt Intrp Diag RR RNR REJ
Send 1 0 1 0 0 0 0 0 0 0
Rcvd 2 1 0 0 0 0 0 0 0 0
[ Confirmation Packets ]
Send 1 0 0 0 0
Rcvd 0 1 0 0 0
Total Sent 3 Total Rcvd 4 Invalids Rcvd 0 Discarded 0
[ Frame Level Information ]
For 6100/6105 Subsystem:
I^P I^NOP RR RNR REJ SREJ SABM DISC FRMR UA DM
Send 0 0 0 0 0 0 0 0 0 0 0
Rcvd 0 0 0 0 0 0 0 0 0 0 0
For NON-6100/6105 Subsystem:
I S U
Send 3 6 0
Rcvd 4 8 0
[ LIU Errors ] [ DRIVER info ]
FCS 0 Modem 0 Length 0 Overruns 0 BCC Errs 0 Frames 774
T1 0 Nobuf 0 Addrs 0 Rvc Abrt 0 No Buffs 1 Errors 0
[ Buffer Pool Information in pages ]
Size 512 In use 3 High Water 4 Failures 0