
OSM Service Connection User's Guide (G06.30+)

The Severity column contains a colored icon corresponding to the severity of the alarm.
Red icons represent Critical and Major alarms. Yellow icons represent Minor, Warning,
and Indeterminate alarms. See Alarm Severity.
Time and date the alarm occurred●
Description of the alarm, including the probable cause●
Whether the alarm is dialed out to your service provider (assuming your system console
is configured to dial out).
●
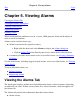
To view alarms in the Alarms tab:
In either the tree or view pane, click a resource.1.
In the details pane, click the Alarms tab to display the alarms for the selected resource.2.
For additional alarm details, right-click on the alarm and select Details.
To act on alarms in the Alarms tab:
Right-click on the alarm and select:
Delete●
Suppress●
Unsuppress●
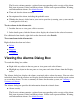
Viewing the Alarms Dialog Box
To reach this dialog box, either:
Right-click any object in the tree pane or view panes and select Alarms.●
Highlight any object in the tree pane or view panes and select Alarms from the Display
menu.
●
The Alarms dialog box displays the alarms associated with a selected resource. You can select
individual alarms for the resource and display detailed information and available repair actions
or act on those alarms. To view a summary of alarms for the entire system, see Viewing a
Summary of Alarms.
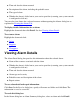
The Alarms dialog box provides this information about the selected alarm:
Alarm severity
The Severity column contains a colored icon corresponding to the severity of the alarm.
Red icons represent Critical and Major alarms. Yellow icons represent Minor, Warning,
and Indeterminate alarms. See Alarm Severity.
●