
OVNM 5.3 - Operations Agent for NonStop Console Guide

2 Console: The Interface
This chapter provides details about the features available with the Console GUI including the
interface components, such as Menus and Toolbar.
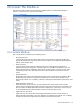
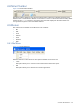
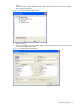
Figure 2-1 Console GUI
2-1 Console Window
The Console window is divided into the following panes.
• Management Pane
Console’s Management pane is the vertical pane on the left side of the window. This pane
displays the Policies tab, which shows the tree-view of all the Active Windows, NonStop Nodes,
Policies, Tools and Web Links.
• Event View Pane
Console’s Event View pane is the horizontal pane seen on the right side of the window
displaying Severity, Receiving Time, Generation Time, Process, SSID, Event Number, OVO and
Event Text information. It displays the system status at various levels. Customers choose which
columns they want to see, what sequence the columns are listed and how the events are
sorted.
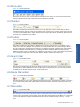
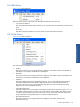
• Host(s) View Pane
Host(s) View pane is the bottom left horizontal pane of the Console window. It displays a list of
HP NonStop servers that are configured along with their connection status. This pane is not
displayed by default. You can display or hide it by selecting the Hosts Window option in the View
menu.
• Event Information View Pane
Event Information View pane is the second horizontal pane in the bottom of the Console
window. This pane displays the detailed real-time event and alert status. The Cause, Effect and
Recovery tab in the Events Information View pane displays the causes, effect and recovery of
an event. The Notes tab enables addition of notes for acknowledged events.
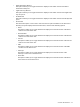
• Application Log View Pane
Application Log View pane is the bottom right horizontal pane of the Console window. It
displays the status of the Elink connection. This pane is not displayed by default. You can display
or hide it by selecting the Application Log Window option in the View menu.
Console: The Interface 13