
OVNM 5.3 - Operations Agent for NonStop Console Guide

3-4 Event View Color Codes
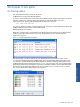
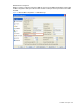
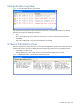
The events displayed in the Event View pane are color coded for easy monitoring. The Node Status
bar at the bottom of the Event View pane displays various color legends along with the number of
events in each category.
Figure 3-6 Node Status Bar
Table 3-1 Severity Level in Node Status Bar
Icon Severity Level
Critical
Major
Minor
Warning
Normal
Unknown
3-5 Host(s) View
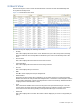
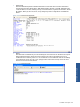
Figure 3-7 Configured Host(s) Window
Console: Concepts
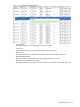
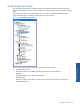
The Host(s) View pane displays information about the HP NonStop servers that are configured. The
following information is displayed in the pane.
• NODE
This column displays the name of the NonStop Server Hosts that are configured. A green icon
next to the node name specifies that the connection is up. A red icon represents that the
connection with the Host is down.
• IP
This column displays the IP addresses of the configured Nodes.
• Port
This column displays the port used for the connection with the Host.
• Uptime
This column displays the percentage time the node in question was up.
Console: Concepts 38