
OVNPM 1.5.2 - Performance Agent for NonStop Concepts Guide


About OVNPM 10
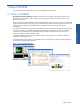
Configurable Views & Application-Specific Dashboards
OVNPM provides predefined views and the ability to create user-defined views, which may contain production
metrics collected over a selected time window, depending on your requirements. Dashboards provide the
functionality to open and manage views and reports in various groups. You can create, modify, copy, print and
open any number of dashboards to keep a series of customized displays available, tailored for particular
requirements or groups of resources.
Replay of Busiest Processes
Critical system events can be replayed to monitor the root cause of the problem. The information in replay mode
includes all collected and stored performance metrics and the busiest processes per CPU and by node. OVNPM's
graphical and alphanumeric displays enable you to quickly and efficiently focus on root causes, and prevent
them from reoccurring. OVNPM’s multiple time frames enable you to choose the fastest and most efficient way to
view system data and analyze events.
User-Friendly Interface
The intuitive OVNPM GUI enables you to perform interactive query sessions to monitor the system state for varied
time periods on a point-and-click basis. Through the interface you can drill-down from a month, into a specific
day of the month, down to hours of the day to see the busiest minutes of that hour, interactively.
Time Window Flexibility
OVNPM provides its users with the ability to monitor node activities in multiple time frames with multiple time
ranges. Depending on the requirement this period can be changed dynamically, allowing the flexibility to
monitor system performance during various time slots. Dashboards can be created with varied time views
displaying system states ranging from the entire day to smaller time frames in real-time to monitor the system's
behavior.
Proactive Resource Management
OVNPM provides discovery of NonStop Server resources for their proactive management. Resources such as
CPU, DISK, Controllers, and Processes can be monitored proactively for their availability as well as resource
consumption. Failure in any of the defined resource components is reported.
Low Cost Diskfile Measurement
DISKFILE was a costly entity to measure before Measure G08. If the system runs Measure G08 or higher,
OVNPM monitors Diskfile like other entities. Diskfile collects on such systems occurs each 30 seconds instead of
2 minutes, which is the default DCPRM.ioInterval. The Diskfile collect cost has decreased even with an interval of
30 seconds.
Exporting Threshold Configurations
OVNPM has a new threshold command line tool. The new tool can be used to export threshold configuration to
a text file. It can also import threshold configuration from a text files. It also provides the functionality to share
thresholds between nodes. Thresholds can easily be managed using the OVNPM Display Agent, but for an
environment with a very large number of Thresholds, command line tools associable with TACL scripting make
management of configurations faster and easier.