
OVNPM 1.5.2 - Performance Agent for NonStop Display Agent Guide

Analyzing Trends: SystemTrend 104
7-6 Customizing Appearance of Views
7-6-1 Changing Report Intervals
After opening a SystemTrend view, you can change the interval of data displayed. For example, you can switch
from a monthly report to an annual report or vice versa. Follow the steps given below to change report intervals.
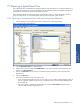
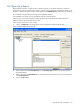
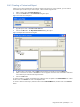
1. Open a view and select the Interval option from the Options menu
2. This opens a submenu of available intervals. The interval currently in use is selected. Select the new interval.
The view is recalculated and displayed.
7-6-2 Scrolling Between Time Periods
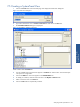
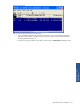
You can scroll back and forth between time periods by selecting Previous Period or Next Period options from the
Options menu. Each selection moves the display one time period in the specified direction. For example, if the
current view displays August 1995, selecting Next Period displays September 1995.
7-6-3 Hiding Values
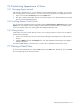
Trend analysis views show several values for a metric, such as average, maximum, minimum. You can hide any
of these values in the display.
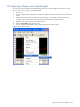
1. Open a view and select the value you want to hide from the legend. If the legend is not visible, maximize
the view.
2. Select the Hidden option from the Histogram menu. The value disappears from the display and it appears
shaded in the legend.
If the choice Hidden appears with a check mark, it is active. To turn off Hidden, clear this menu choice.
7-7 Closing a Trend View
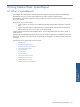
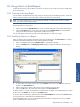
To close an open SystemTrend view, select the Close option from the View menu. Alternatively, click on the Close
box in the upper-right corner of the trend window.