
OVNPM 1.5.2 - Performance Agent for NonStop Display Agent Guide


Using Tabular Data: SystemReport 105
8 Using Tabular Data: SystemReport
8-1 What is SystemReport?
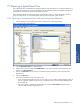
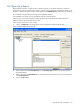
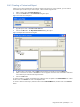
SystemReport shows detailed data in tabular reports that complement the graphic displays of SystemInsight.
SystemReport is the tool you use to analyze data that was used to calculate a graphic display.
In SystemReport, each column represents a metric and each row a metric value. You can sort the data in a report
by any of its columns.
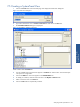
There are two ways to access reports:
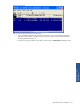
• Open a report as you would a view to observe and analyze real-time data or playback recent past
data.
• Open a report from within a SystemInsight view to analyze data at a specific interval in the display.
You can do this for views in curve, layer, or plot display modes.
OVNPM supplies an extensive set of predefined reports. You can adapt these reports to meet your needs, or
create your own.
SystemInsight and SystemReport display the same types of information, although they use different presentation
formats. For this reason, most actions that do not specifically involve graphics or tables are valid for both views
and reports.
The following actions apply to both views and reports:
• Selecting Units
• Changing the Time Interval
• Stopping and Starting the Display
• Viewing Recent-Past Data
• Using Comments
• Exporting Data
• Printing a Report
• Copying to Another Domain
• Changing a Report Name
• Locating Metrics and Units
• Copying a Report to a Dashboard
Using Tabular Data:
SystemReport