
OVNPM 1.5.2 - Performance Agent for NonStop Display Agent Guide

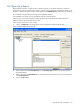

Using Tabular Data: SystemReport 108
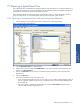
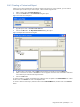
8-3 Opening a Report from SystemInsight
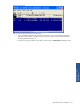
You can open a report directly from a SystemInsight graphic view to analyze data for a specific point in time.
The view can be a curve, layer, or plot display mode.
1. Open a view.
2. Click on a specific point in the display. A vertical line appears at that point. This line marks a specific time
interval.
3. The time of the interval is shown above the line (for example, 11:56:00 AM). To adjust the interval, if
necessary, click on another point or drag the vertical line with the left and right cursor keys.
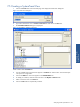
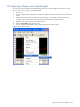
4. Right-click in the display area to access a shortcut menu.
5. Select the Open Report option from the menu.
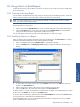
6. A list of available reports appears. Select a report from the list to open the report.
Figure 8-3 Open Report Option