
OVNPM 1.5.2 - Performance Agent for NonStop Display Agent Guide

Using SystemAlert 125
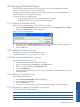
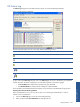
9-8 Alarm Log
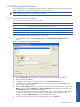
The Alarm Log tab page shows the date and time an alarm was issued and threshold information.
Figure 9-13 Alert Alarm Log Tab Page
The following table explains the icons in the Alarm Status and Alarm log windows.
Icons Explanation
Represents alarms that are in alert status.
Represents alarms that have returned to normal status.
Represents an alert for server problems.
Represents group alarms in normal status.
Represents group alarms in alert status.
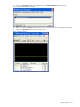
To gain access to the Alarm Log tab page, click on the Alarm Log tab as soon as a threshold or group threshold
reaches alert status. The alarm is displayed in one of the following boxes on the Alarm Log page:
• The Group Alarms box displays alarms resulting from group thresholds.
• The Threshold Alarms box displays alarms resulting from simple thresholds.
The Group Alarms and Threshold Alarms boxes display concise summaries of the thresholds issuing the alarm.
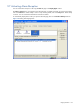
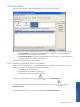
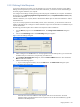
Opening a View from the Alarm Log Window
When a threshold alarm occurs, you may want to open a view containing the threshold metric in order to
examine current or past behavior.
1. Click on the Alarm Log tab to access the corresponding tab page.
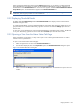
2. Select an alarm from the Threshold Alarms box and right-click on it.
Using SystemAlert